

Don’t know what the Current Ratio is and why it matters? We’ve got you covered. It doesn’t matter if you’re a complete novice in this finance landscape; this article will help you break down each topic in a straightforward way.
As we know, we don’t invest or lend money just by knowing a name; we review and analyze the record of a borrower, whether it’s a company or a person, since we can’t risk our hard-earned cash without knowing a company’s health.
However, there is a proper method to gauge if a business is worth investing in or if it can pay its short-term bills without sweat. That method is called the Current Ratio.
However, there could be nuances that we’ll discuss later in this article. So, before taking any more time, let’s barge forward.
What Is the Current Ratio?
The Current Ratio is nothing but a liquidity ratio that measures the liabilities and debt of a company and gives a rough idea of whether it can pay off its debt within a year using its short-term assets.
If a company is already in surplus and will be more profitable next year (considering the current growth), then investors, entrepreneurs, or analysts can think of pouring their cash into it.
However, there will always be a risk, no matter how positive a current Ratio sounds. So in a nutshell, it indicates whether the company has sufficient “quick” resources to cover its outstanding obligations soon.
It’s expressed as a number, like 2:1, meaning for every $1 of debt, there’s $2 in assets.
What’s more? A strong Current Ratio shows good liquidity—no panic selling assets or borrowing more. But too high might mean idle cash not growing the business.
How to Calculate Current Ratio: Formula With Example
It’s no rocket science. The formula is straightforward:
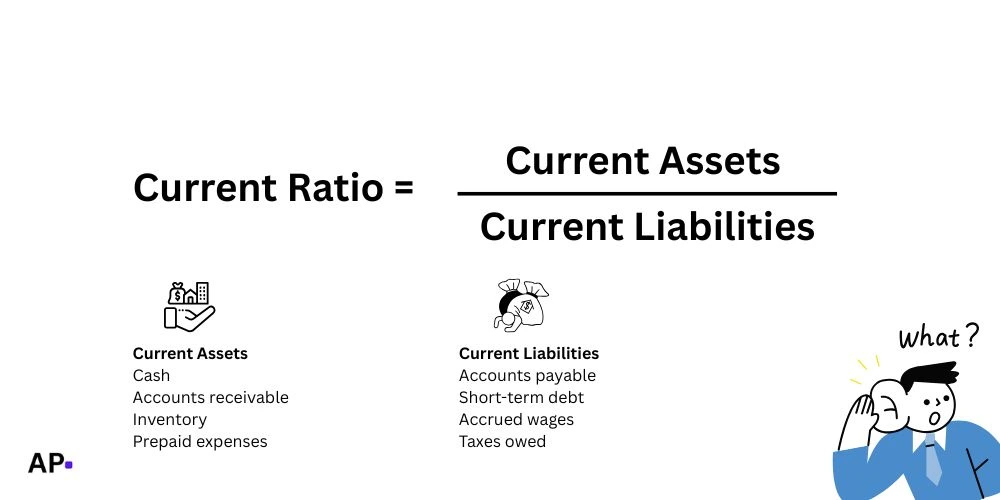
Current Ratio = Current Assets ÷ Current Liabilities
In the current times, it’s not hard to find any company’s details, thanks to the digital revolution that changed the game forever for investors.
You can navigate a company’s balance sheet from its official site, annual report, or any other financial sites, such as Yahoo Finance.
- Current Assets: Cash, accounts receivable, inventory, prepaid expenses—stuff turning to cash within 12 months.
- Current Liabilities: Accounts payable, short-term debt, accrued expenses—bills due in the next year.
For example, if Company XYZ has $500,000 in current assets and $250,000 in current liabilities:
Current Ratio = 500,000 ÷ 250,000 = 2.0
That means a healthy 2:1 ratio.
It’s worth noting that you use the recently published annual or quarter data. To streamline the process, you can take the help of tools like Excel or financial calculators.
What Is a Good Current Ratio?
There’s no one-size-fits-all, but here’s the benchmark you can look at:
- Above 1.0: Good—the company can cover debts. Ideally, 1.5 to 3.0 for most industries.
- Below 1.0: Red flag—potential liquidity issues, like struggling to pay suppliers.
- Too high (over 3.0): Might mean excess inventory or poor asset use.
But it varies depending on the industry. For instance, retail might aim for 1.5 (high inventory), while tech could be 2.0+ (more cash).
When comparing to peers! Apple might have 1.1 (efficient), but a startup could need 2.0+.
How Does Current Ratio Work in Real Life?
Just think you’re lending $100 to a friend who already owes $200 tomorrow, then there’s a problem. So Current Ratio is like checking their “wallet” vs. “bills.”
In stocks: A low ratio might signal bankruptcy risk (think Enron vibes). High? Stable growth potential.
Banks use it for loans—if below 1, no approval. Investors scan it in earnings reports.
Example: Tesla’s Q3 2025 balance sheet (hypothetical for demo):
- Current Assets: $30 billion
- Current Liabilities: $20 billion
- Ratio: 1.5 (Solid for auto industry—covers debts with room).
Limitations of the Current Ratio?
It’s great for a quick liquidity peek, but not perfect—far from it. As we know, no single ratio tells the full story, and this one has blind spots that could trip you up if you’re not careful.
What’s more? It ignores asset quality. Sure, inventory counts as a current asset, but what if it’s piled-up junk that won’t sell fast (or at all)? That exaggerated number looks good on paper, but fails in reality.
Here’s another catch: it doesn’t factor in timing. Receivables might be “current,” but if customers pay late, cash isn’t flowing when you need it.
And long-term health? Totally overlooked—no clue on debt maturing years out or overall solvency.
Plus, industries ruin it. A retailer with slow-moving stock might show “healthy,” while a service firm shines cleaner.
However, you can pair it with Quick Ratio (excludes inventory) for a fuller picture.
Why Current Ratio Changes Over Time?
There could be several reasons why it changes or how it changes. One of the major reasons is the Seasonal Swing. For instance, just think retailers are loading up on inventory for Black Friday or Christmas rushes.
They’ve more stocks, which means bloated current assets, but temporarily. When January hits, all retailers will clear shelves, and the ratio drops because their inventory shrinks.
Another factor that affects it is Economic dips. In such a period, receivables are slow, since customers delay payments, and cash arrives slowly.
As a result, the Ratio drops as assets “freeze” while liabilities (like supplier bills) pile up.
When a recession hits, companies save cash to stay safe, but they already face sales drops due to unsold items in warehouses. This all affects the Current Ratio, and no new investor wants to pour in cash.
How to Improve a Low Current Ratio?
For business owners:
- Boost assets: Collect receivables faster, sell excess inventory.
- Cut liabilities: Pay down short-term debt, negotiate supplier terms.
- Avoid: Don’t just borrow more—that worsens it long-term.
Frequently Asked Questions
The Quick Ratio (also known as the Acid-Test Ratio) is stricter: (Current Assets – Inventory) ÷ Current Liabilities. Skips slow-selling stock.
Rarely, but yes—if liabilities exceed assets big time (insolvency alert).
No. Working Capital = Current Assets – Current Liabilities (dollar amount). Ratio is the proportion.
Not necessarily—could signal inefficiency, like hoarding cash instead of investing.
Quarterly for investors. Annually for casuals. Use free tools like Google Finance.
Balance sheets on SEC.gov, Yahoo Finance, or company sites. Many calculators auto-compute it.
Wrapping it Up
We hope this article cleared up the Current Ratio and how it works for you. We’ve covered the basics, formula, examples, and tips to make you savvy on liquidity.
To sum up: Aim for 1.5-2.0, calculate from balance sheets, and always compare industries. It’s a quick health check—use it with other ratios for the full story.
In rare cases, ratios may be misleading due to accounting tricks, so cross-check with cash flow statements. Got stocks in mind? Pull their latest reports and crunch the numbers yourself! #FinanceTips #InvestingBasics
You Might Also Like: Understanding ROA (Return on Assets)