

Did you know that in 2023 alone, over 42% of U.S. small businesses faced cash flow crunches that nearly shut them down—yet many could’ve spotted the warning with one simple number?
That number? The Quick Ratio.
It’s not just another boring finance term—it’s the silent alarm that saved giants like Tesla during supply chain chaos (holding a rock-solid 1.6 while others dipped below 0.4) and sank retail chains that looked “healthy” on paper.
Curious why a single ratio can predict bankruptcy 6–12 months ahead better than revenue trends? Or how a 0.1 difference in this metric once cost a company $18 million in emergency loans?
Stay glued. By the end of this guide, you’ll not only understand the Quick Ratio—you’ll be able to spot financial red flags in any business, from startups to Fortune 500s, faster than most accountants.
What Is Quick Ratio
The Quick Ratio or it’s also known as the Acid-Test Ratio,is a key financial indicator that measures a company’s ability to pay off its short-term debts using only its available assets.
It zeroes in on cash, marketable securities, and accounts receivable, or whatever can convert to cash quickly. However, it doesn’t include inventory.
Unlike the Current Ratio, it is strict, as it relies heavily on the accessible liquidity.
It’s really helpful for investors, lenders, or anyone analyzing whether a business can stay strong in the short term.
Also, when times get tough, like in a recession, a good Quick Ratio shows the company can hold up without trouble.
Formula
Its formula is quite straightforward.
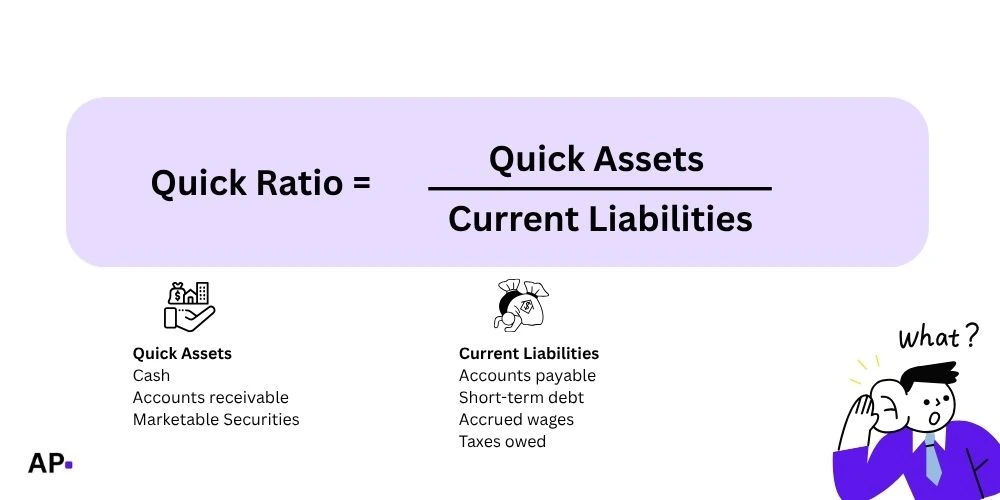
Or, simplified: Quick Ratio = Quick Assets / Current Liabilities
Quick assets are just the money you can grab right now to spend or pay something off, no hassle. Think actual cash in your wallet, a quick check from a friend that’s due today, or money in a savings account you can pull out in seconds.
But guess what? It doesn’t include things like a box of unsold cookies (that’s inventory, which might take time to sell) or cash you’ve already handed over for next month’s bus pass (prepaid expenses, locked in ahead).
On the other hand, “current liabilities” are the bills or debts staring you down soon— you’ve to pay back in the next year or less.
You add them together in something like the quick ratio, and figure out if you’ve enough instant cash to cover these upcoming bills without selling things or borrowing more.
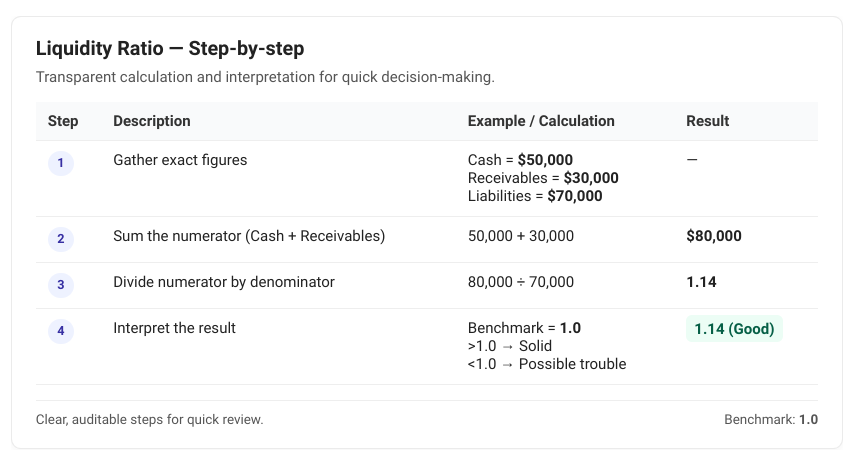
Here’s How To calculate it step-by-step:
- Grab the balance sheet; it’s usually right there in the report.
- Add up Cash, Cash Equivalents, Marketable Securities (e.g, stocks), and Net Accounts Receivable.
- Next up, divide that total Quick Assets by Current Liabilities, and you’ll get your Quick Ratio.
For math pros, here’s the LaTeX version:
Quick Ratio = Cash + Cash Equivalents + Marketable Securities + Accounts Receivable/Current Liabilities
Examples
Let’s calculate it step-by-step. Suppose Company A has:
| Assets + Liabilities | Amount (USD) | Notes / Formula |
|---|---|---|
| Cash | 20,000 | — |
| Marketable Securities | 10,000 | — |
| Accounts Receivable (money customers) | 15,000 | — |
| Current Liabilities (bills, loans, e.t.c) | 40,000 | — |
| Quick Assets | 45,000 | 20,000 + 10,000 + 15,000 |
| Quick Ratio | 1.125 | 45,000 ÷ 40,000 |
| Interpretation | — | Slightly above 1 — good, they can pay debts quickly |
Now, Company B (With inventories):
| Assets + Liabilities + Inventory | Amount (USD) | Notes / Formula |
|---|---|---|
| Cash | 5,000 | — |
| Receivables | 10,000 | — |
| Inventory | 50,000 | Excluded from Quick Assets |
| Current Liabilities | 30,000 | — |
| Quick Assets | 15,000 | 5,000 + 10,000 |
| Quick Ratio | 0.5 | 15,000 ÷ 30,000 |
| Interpretation | — | Below 1 — risky; may need to sell inventory or borrow |
Real-world: Apple Inc. often boasts a Quick Ratio around 1.0-1.5, thanks to massive cash reserves. A manufacturing firm might dip lower if receivables are slow.
How To Calculate Quick Ratio From the Balance Sheet
Navigate the balance sheet—you’ll find it in the company’s quarterly (10-Q) or annual report (10-K). Here’s what to do next:
- Find Quick Assets (except inventory or prepaid expenses).
- Find Current Liabilities.
- Calculate: Once you’ve found all the assets and figures, apply the formula, and you’ll get the results.
That’s it. Takes under a minute once you have the numbers. Use the latest report for accuracy.
When using tools like Excel, enter values in cells, use =SUM for the numerator, and divide. Or use online calculators, but make sure you always verify sources.
What Is A Good Quick Ratio
Generally, 1:1 or higher is ideal—it means assets cover liabilities 1-to-1. But it varies:
- Tech companies: 1.5+ (high cash).
- Retail: 0.5-1 (inventory-heavy, but Quick excludes it).
- Below 0.5: Red flag, potential bankruptcy risk.
Industry averages matter—compare peers. If it’s too high (e.g., 3+), it might mean idle cash not invested.
Quick Ratio vs Current Ratio
As we’ve already covered, the Current Ratio includes inventory, while the Quick is quite stricter as it excludes slow sellers.
Example: If inventory is $20,000 in our first case, the Current Ratio = ($45,000 + $20,000) / $40,000 = 1.625 (looks better, but less realistic for quick pay).
You can use Quick for conservative analysis and Current for a broader view.
Limitations
It ignores timing—receivables might be overdue. Besides, it doesn’t account for seasonal fluctuations or off-balance-sheet items. It works best with other ratios like Debt-to-Equity.
Frequently Asked Questions (FAQs)
It signals liquidity issues if it’s below 1.
Cash Ratio is even stricter: (Cash + Marketable Securities) / Current Liabilities—excludes receivables and inventory.
Yes, over 2-3 might mean inefficient cash use.
Yes, interchangeable terms.
Quarterly, or during financial reviews.
No, they’re not liquid.
It can boost the ratio, but only if those customers actually pay.
Wrapping it up
I hope this article has helped you decode the Quick Ratio, its formula, with real-world examples. I’ve covered almost everything, from definitions to calculations, with step-by-step guides.
However, to sum up, just hold the balance sheet numbers, sum quick assets, divide by liabilities, and interpret against 1.0. On top of that, compare industries and pair with other metrics to get a comprehensive view.
Sometimes the formula or numbers look a bit different. That’s usually because of accounting rules (like GAAP vs. IFRS). In such cases, just stay calm and double-check the official reports.